A few months ago while doing several experiments I did a more thorough analysis of the SPIKE Prime app itself. Generally, I am more than interested in how other developers design software architecture and also have a few hobby projects in mind where knowing the bits and bolts is essential.
This is how I learned about the SPIKE App Debug Mode, which also works in the Robot Inventor App – working with both hubs, the LEGO Mindstorms Robot Inventor (51515) and the SPIKE Prime (45678) hubs.
Quick architecture overview
The applications follow a modern application design pattern: the app itself was coded using React.js framework using JavaScript (TypeScript) and is rendered in a browser, like the one you are reading this post in. The trick is that the app logic itself is packaged into an executable that is downloaded from the respective appstore, like Microsoft AppStore for my Windows laptop. The Electron framework that enables this is also widely used – such as the pandemic superstar Microsoft Teams application or Slack.
For a long time, this HTML5 app as an executable concept had a caveat with functionalities that the browser itself cannot accomplish, such as direct hardware (e.g. USB or Bluetooth) access. There are multiple approaches to circumvent including a precompiled binary such as WebAssembly (wasm). There are new standards for direct browser BLE access, yet last time I have checked LEGO used the Electron callout for binary access to precompiled dotnet dll’s. That is a perfect solution as well.
Enabling the Debug Mode
Warning: we will be tweaking directly with internal files – use it on your own risk as you might change things that would prevent the app from starting.
Head to the Roaming directory of the installed app and open the settings.json file in a text editor. Make sure the app is not running.
C:\Users\user\AppData\Local\Packages\LEGOEducation.SPIKELEGOEducation_by3p0hsm2jzfy\LocalCache\Roaming\SPIKE\C:\Users\user\AppData\Local\Packages\TheLEGOGroup.LEGOMINDSTORMSInventor_m36angppq0g76\LocalCache\Roaming\MINDSTORMS_ROBOTINVENTOR\
Change the line or create a new if there is no such line for ui.debug key and set it to true.

Start the app and the chocolate factory of Willy Wonka will open for you, showing up an extra Debug menu with 3 functions and a debug toolbar with 14 functions in the bottom.

The debug functions allow you to look behind what is running on your favourite LEGO platform.
Debug Functions in order of my choice
Menu: Toggle Developer Tools
Opens up the standard Chrome Developer tools, that enables full inspection of the DOM tree, React component explore if extension is installed and debug console.
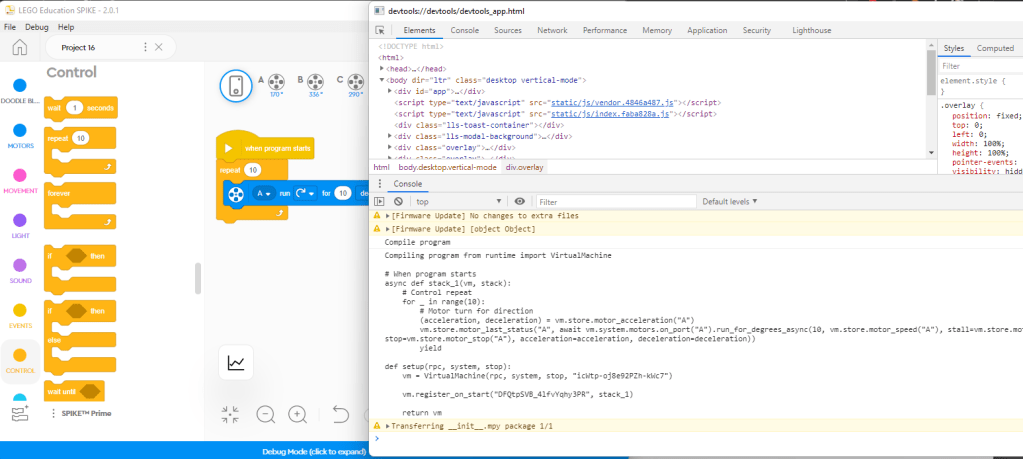
In the debug console, the compiled pyton code is logged once you start downloading the app to the hub.
Footer: Open url in browser
The application itself runs in an Electron container – Mac or Windows executable of a browser without gadgets like an url bar. Still behind there is a web server -probably a node- that makes sure that react app runs smoothly.
I was wondering for a while whether this is really necessary as both the node server and the “frontend” uses the same chrome engine, still for sake of simplicity and development time, I would chose the same approach.
This enables you to open up the app core outside of the Windows/Mac app in a regular web browser, while the app is running and access most of the functionalities. Rather a nice to have, still might be a good starting point later.
Menu: Reload and Menu: Force Reload
Is a neat developer option that has probably less importance as the app in the released state is quite stable. Reloads the app within the Electron container to clean up state.
Footer: Toggle Canvas Background
Toggles the background dot pattern of the app canvas – useful for screenshot purposes.
Footer: Download to SVG
Useful for exporting the SVG graphics directly from the canvas. Can only be used if you open a separate chrome window.
Footer: Dump canvas to clipboard, Dump program XML to clipboard, Export block IDs in toolbox
The app itself uses the MIT Scratch framework, so a developer can access directly the blocks here.
I really appreciate this function as I was experimenting with this awesome toolkit and library in the EV3TreeVisualizer project as well.

Footer: Check for content updates
Content (lessons) check – probably useful if you change the content channel to a non-official one.
Footer: Dismiss all toasts
Probably the developers had quite a lot of issues with stuck notification (toast) messages.
Footer: Change log level
You can check in the developer tools window what actions are performed. In the console the the app regularly adds debug information. You can manually set what level of information you are interested in – Error, Warning or Info.
Footer: Connect with web BLE
Interesting one – could not get it working. Probably a future direction to use the browser bluetooth access instead of the native binary support LEGO had to include.
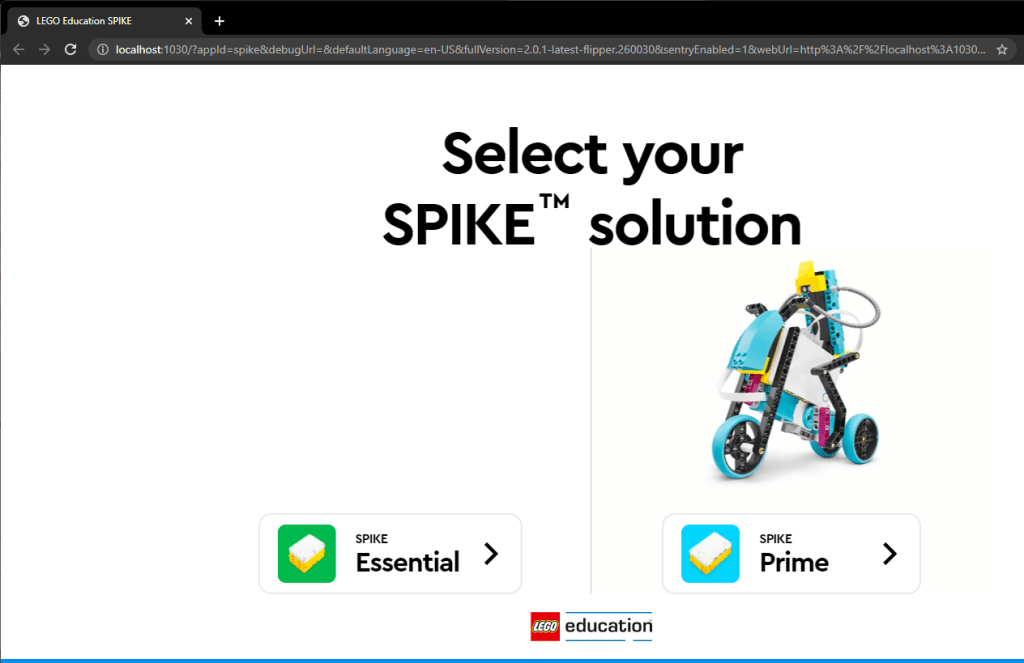
Footer: Change selected product
Manual switch between SPIKE Prime and SPIKE Essential and all.
Footer: Show doodle blocks
Rather nice one.
Doodle blocks do not generate code, yet are used for lesson tutorials. An awesome way to create your own education content using the doodle blocks for pseudocoding.

Footer: Log line graph data
Opens the line graph ware.
Footer: Mock platform
Lets you change which platform the browser thinks it runs on. Could not find the relevance.
Conclusion
Happy hacking and take care!
Let me know if you find any new options or make good use of this.
LEGO is continuously trying to create new and better ways to code their programmable bricks and with the SPIKE Essential – Prime intercompatibility finally started to move towards the LEGO learning continuum I am waiting for quite a while.
Great job LEGO!

Any idea how to enable app debug mode on Mac OS?
LikeLike
Unfortunately no, but would assume that you can edit a the very same settings.json file. The challenge is to find the right location.
I would starte here
“The macOS equivalent to Windows’s AppData folder is located in three subfolders of the hidden Library folder: Application Support, Caches, and Preferences. This Library folder belongs to the Home folder, often referred to as ~/Library, so do not confuse it with the other two Library folders on Mac.”
https://iboysoft.com/wiki/appdata-for-mac.html
Hope you find it and when you find it – would be grateful to get the update from you here as well.
LikeLike
After looking at various folders for hours, I finally found the userSettings.json file here:
/Users//Library/Containers/com.lego.education.spike/Data/Library/Application Support/SPIKE/userSettings.json
Just add the “ui.debug”:true as in your instructions, then restart the app.
Thanks. I will explore the various new features available through this App debug mode.
LikeLike
The file path for Robot Inventor’s userSettings.json file is here:
/Users/userName/Library/Containers/com.lego.retail.mindstorms.robotinventor/Data/Library/Application Support/MINDSTORMS_ROBOTINVENTOR/userSettings.json
LikeLike
Thanks for all this. How would I enable that debug menu in the browser implementation?
In the chrome browser developer tools I see the Transfering __init__.mpy package console messages as you show above, but I have not yet found the intermediate clear python code.
LikeLike
Excellent question! Do you know how to use the Chrome debug tools?
Just open the debug tool, head for application, click and drop down local storage, select the … legoeducation.com url and check and edit the settings key.
https://digitalbrick.home.blog/2022/10/07/debug-mode-and-assert-node-in-the-web-version/
LikeLike
Hey, so I was digging around the files the spike prime (I think) uses.. and can’t find where they store the local files. I found a folder called locales but it doesn’t seem to include anything real.
Any help with this would be much appreciated (Trying to translate this for my group).
Thanks in advance!
LikeLike
Awesome, thanks for the add!
LikeLike
More asking if you know where it stores the actual locales then giving info..
LikeLike
No idea unfortunately.
Funny though – in 2014, when O started coaching for FIRST LEGO League, I also started translating the EV3 Lab app.
Quickly enough I came to realize that a few English word does not hinder the kids. So I just let the translation go and eversince I have seen that English as an interface teaches kids to important skills…
LikeLike